Case studies / 01
Five rounds of partner reports from 47 organisations, in one public evidence portal
We audited years of reporting from the Social Employment Fund's implementing partners, built the evidence base behind it, and now run the public portal that shows what the fund's partners reported, by partner, theme and indicator.
- Client
- Brownie Points
- For
- Social Employment Fund, funded through the Presidential Employment Stimulus
- Period
- June 2026 to date
- Our role
- Audit, build and ongoing management of the fund's evidence data and public portal
- Status
- Live. Round five reporting in progress
Live platform
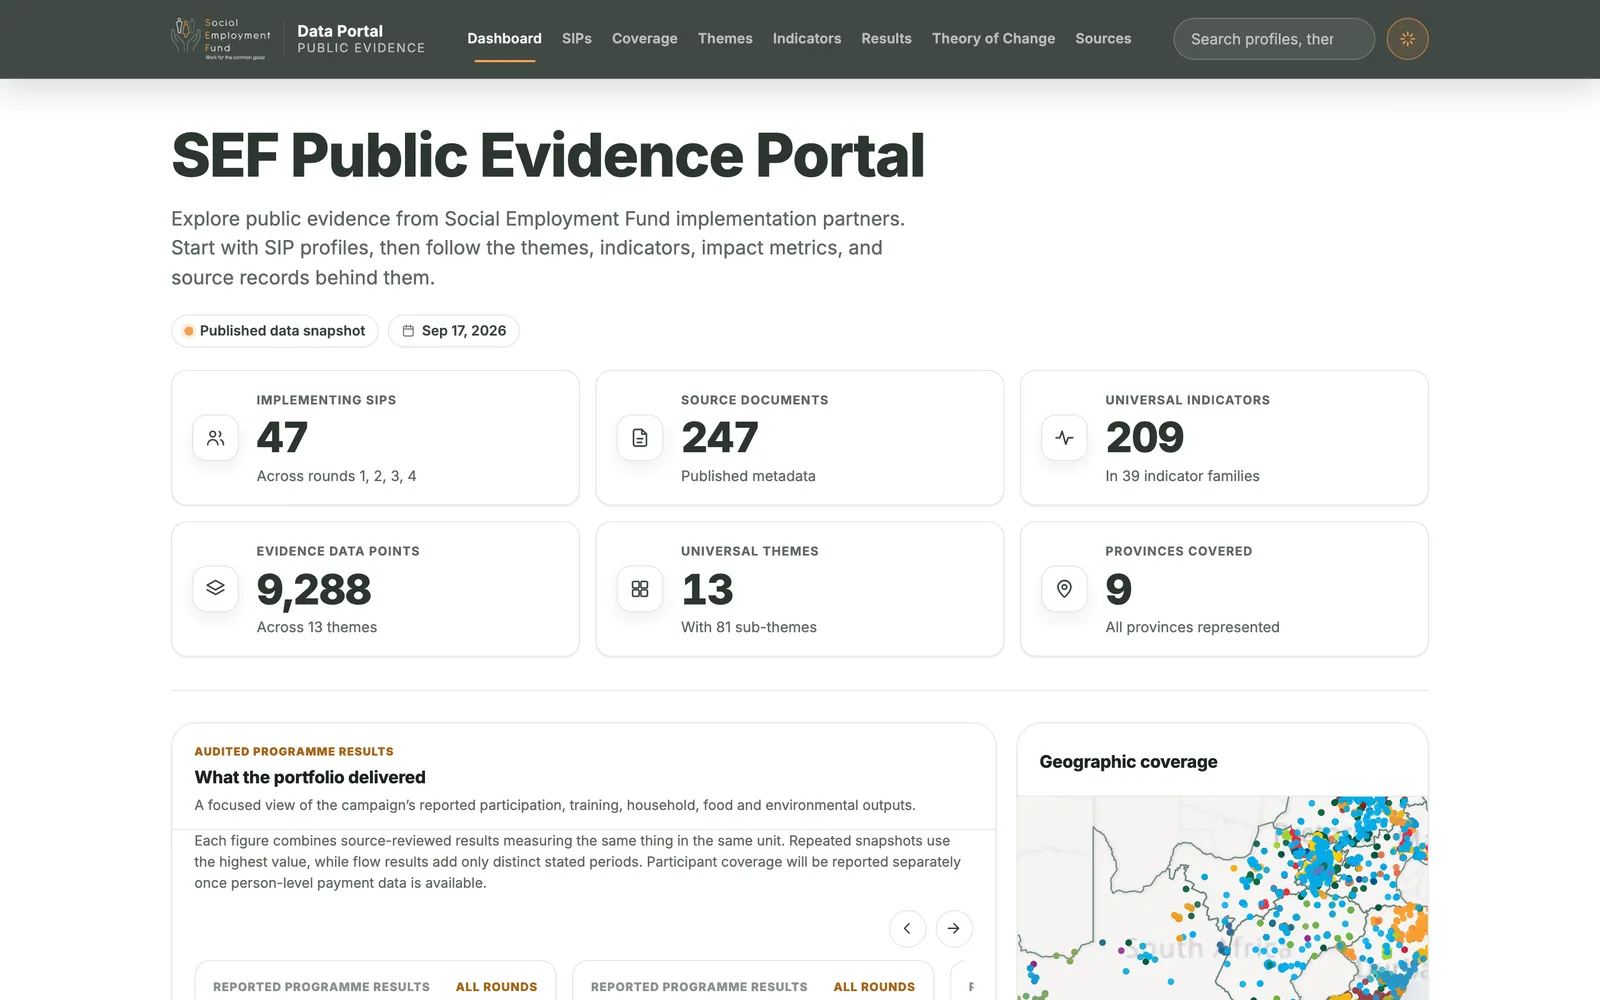
SEF Public Evidence Portal
The portal is public. Open it to see the partner profiles, themes, indicators and results described below, with the source behind each figure.
-
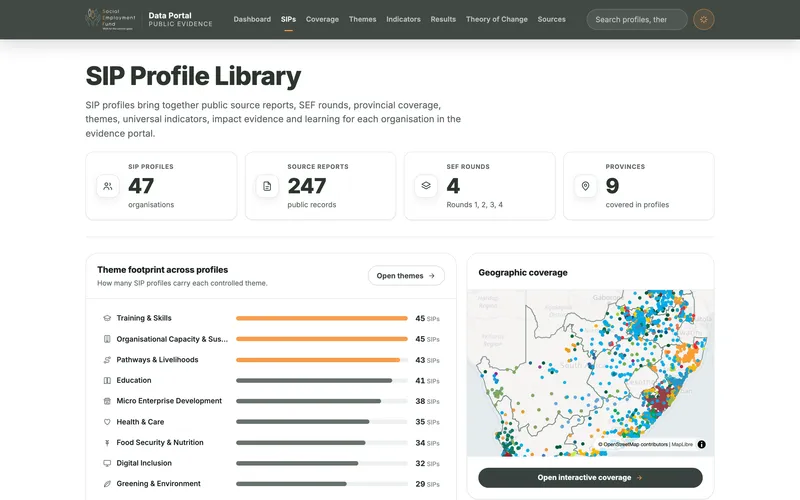
Partner profiles
One profile for each of the 47 implementing partners.
-
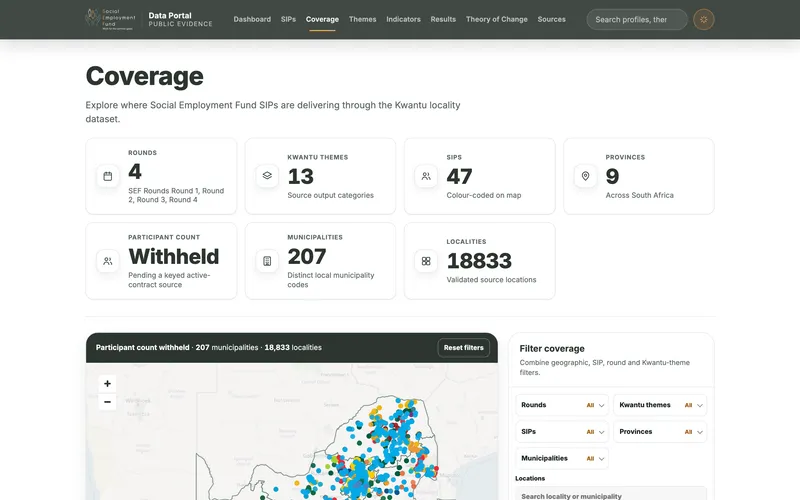
Coverage map
Where partners work, down to municipality and locality.
-
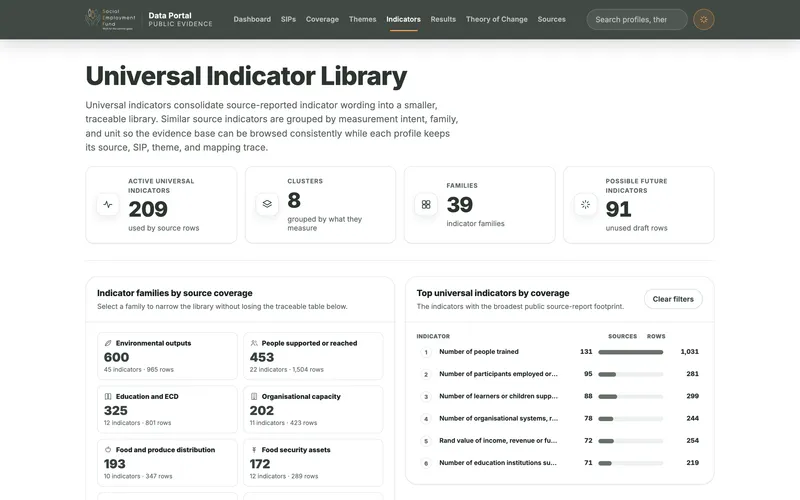
Indicator library
The 209 universal indicators, grouped into 39 families.
-
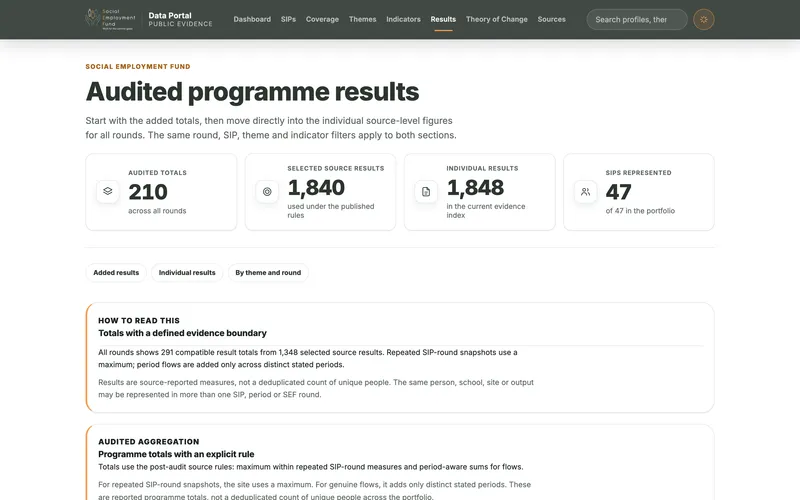
Results
Reported results by round, partner, theme and indicator.
-
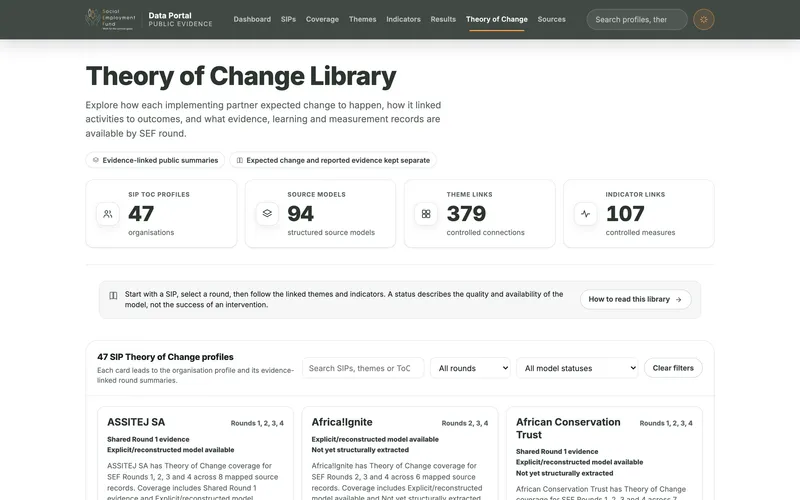
Theory of change
The theory of change for each partner and funding round.
-
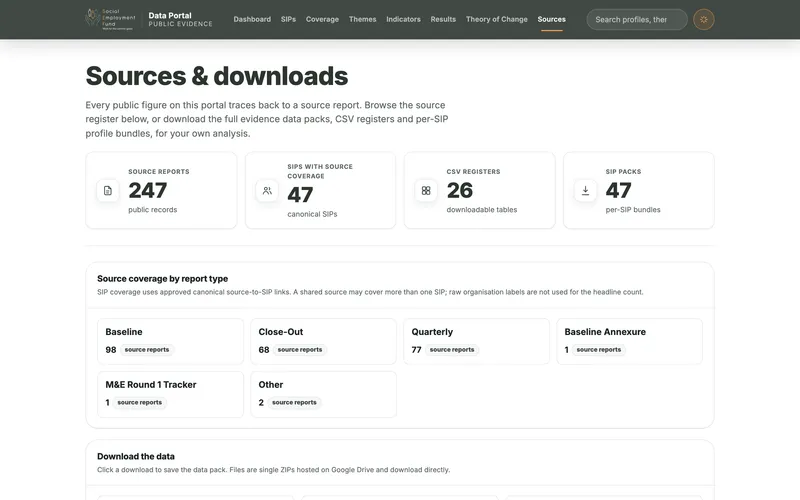
Source library
Every partner report the figures come from.
The portal is updated as each reporting round is published, so its counts can trail the figures on this page.
The problem
The Social Employment Fund pays civil society organisations and social enterprises to create part-time work in food security, education, health, the environment, community safety and other areas. Each implementing partner reported quarterly and at close-out, in its own format, with its own themes and its own indicators.
Two partners could count the same thing under different names. The same name could mean two different measurements. Activities, outputs and outcomes sat in the same tables. Nobody could add a result up across the fund and say where the total came from.
What we did
We started with an audit of what had been reported and how. Every report was then logged in a source register before anything was extracted from it.
Extraction ran against fixed schemas for themes, indicators and results, with AI doing the first pass and people reviewing the output. Partner wording was kept at source level. Programme-wide themes and indicators were built above it, so a consolidated indicator still points to the partner, report, page and passage it came from.
Totals on the portal add only results that measure the same thing in the same unit. Where a figure counts something different, such as participant allocation records, it is shown on its own and never added to the rest.
We then built a theory of change library for each partner and each funding round, and linked it to the same themes and indicators. Each new reporting round now goes through the same route.
- 294 source documents
- 9,288 evidence data points
- 209 universal indicators, 13 themes
- 1 public portal
What we built
- A source register for every partner report
- A universal theme and indicator library, linked to source-level records
- 298 structured datasets covering themes, indicators, results and sources
- Results extraction by indicator, theme, partner and fund
- A theory of change library for 47 partners
- A public evidence portal with partner profiles, theme and indicator libraries, a source library and a coverage map
- A repeatable process for each new reporting round
The work in figures
- 47 implementing partners
- 294 source documents
- 9,288 evidence data points
- 209 universal indicators in 39 families
- 13 themes and 81 sub-themes
- 91 theory of change models, explicit or reconstructed
- All 9 provinces
- 5 reporting rounds (round five from September 2026)
As at September 2026. The figures grow with each reporting round.
What changed
The fund and its partners can now see, in one place, what was reported by each partner, under each theme and against each indicator, and open the source record behind any figure. For example, the portal shows 225,355 people trained across all rounds, built from 589 results reported by 37 partners in 108 source documents.
Limits
The portal shows what partners reported. It does not independently verify delivery on the ground, and it says so.